Hijacking Sagemath’s REPL for Fun and Kittens
Sagemath is an amazing piece of mathematical software. It can work with impressively abstract concepts as well as with elementary ones, and offers a very wide variety of functionalities.
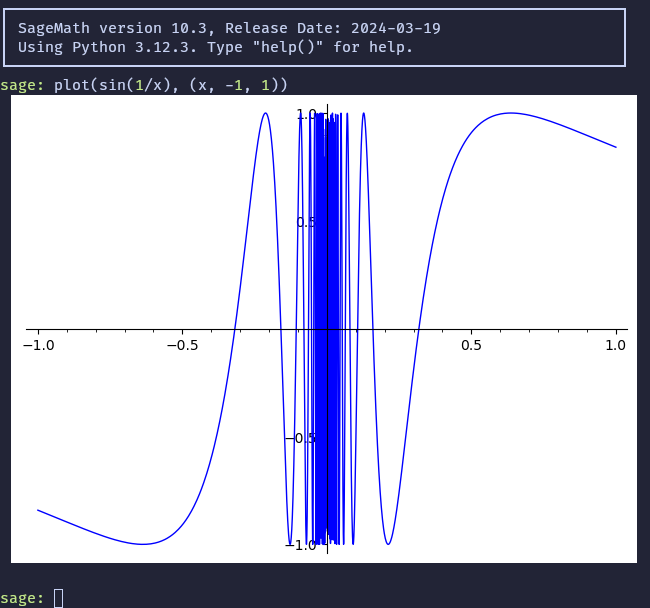
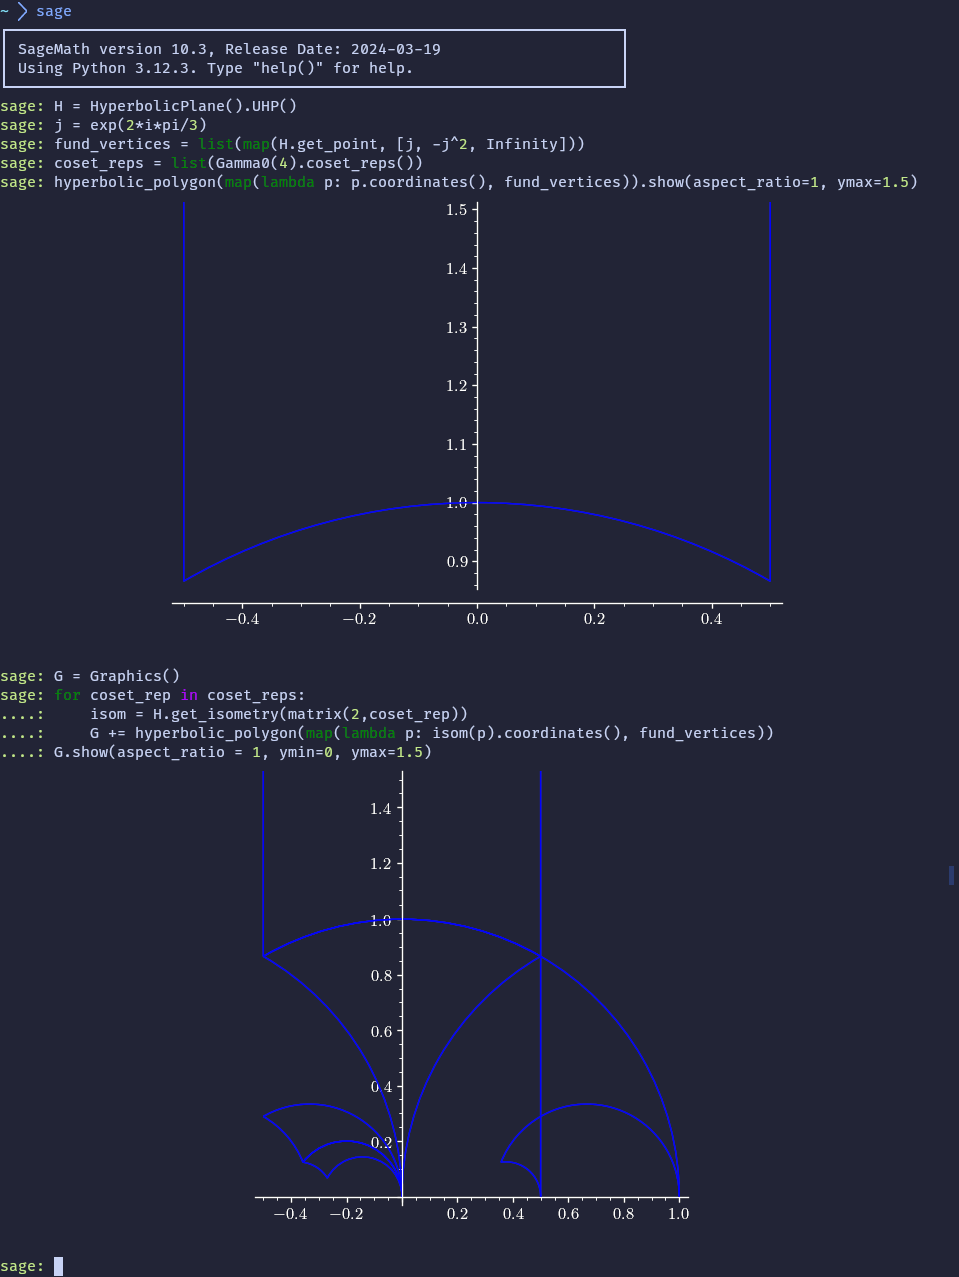
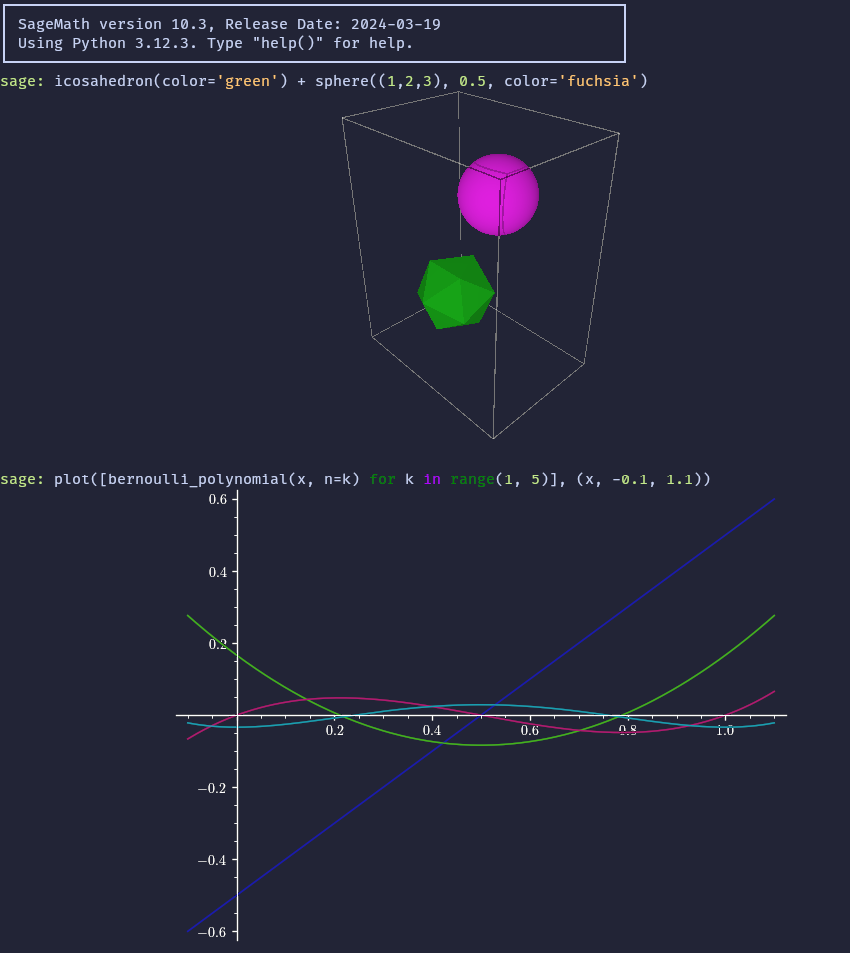
Among the numerous capabilities of Sage is plotting. Sage can do it all: 2D, 3D, explicit, implicit, parametrized, interactive, animated, you name it. To use these functionalities, you need either: a notebook-like interface to display graphics objects in between cells; or a terminal running in a graphical server, so that sage will open a file viewer for generated graphs.
Having recently made the switch over to the kitty terminal, which notoriously implements the kitty image protocol, a more modern alternative to the sixel protocol used by other capable terminals, I feel compelled to bake support for the kitty protocol in Sage.
Hacking Sage’s IPython backend⌗
Sagemath offers the option to use a custom command to open different file types via the default_viewer() function and its associated Viewer class. Unfortunately, looking at the actual call to the command, in BackendIPythonCommandLine.launch_viewer, the standard output is discarded immediately:
os.system('{0} {1} 2>/dev/null 1>/dev/null &'
          .format(command, image_file))
This is reasonable when opening GUI applications, especially when using xdg-open which is the default. However, for terminal graphics protocol, the actual picture is sent via stdout, which means simply using viewer.png_viewer(app='kitty +kitten icat') will not work.
There are two logical paths here: either change sage’s source code, or patch it at runtime. The first one would be the most reasonable (albeit slow and tedious). I might end up contributing to sage upstream, as you’ll see the issues I bring up in this blogpost are not so hard to fix. In the meantime, I decided to patch this behavior.
Let’s see who calls this launch_viewer method: it is essentially called by the displayhook method in the same class, which takes a rich output and chooses the right way to display this output depending on the actual type of that rich output. Basically, it’s a bunch of if/elif/elif/... going over all the reasonable displayable types and calling an external viewer via launch_viewer whenever appropriate. Good! This means we can reasonably patch this method without changing its behavior in most cases. Let’s see what that looks like.
from sage.repl.rich_output import get_display_manager
from sage.repl.rich_output.output_catalog import OutputImagePng,OutputImageGif,OutputPlainText

dm = get_display_manager()
old_backend_displayhook = dm._backend.displayhook

def dh(plain_text, rich_output):
    if isinstance(rich_output, OutputImagePng):
        filename = rich_output.png.filename(ext='png')
        plain_text_str = plain_text.text.get_str()
        os.system('kitty +kitten icat {0}'.format(filename))
        return ({'text/plain': ''}, {})
    return old_backend_displayhook(plain_text, rich_output)

dm._backend.displayhook = dh
Here, dm is the instance of the singleton class DisplayManager, which references the BackendIPythonCommandLine instance we’re looking for through its _backend property. As you can see, we’re not leveraging launch_viewer, because we need stdout to not be discarded.
This code can be put in ~/.sage/init.sage to incorporate this new behavior into every session.
Although pretty amazing, this solution did not feel entirely satisfactory: the stark contrast of the bright plot against the dark blue background is quite jarring to the eye, especially when you’re used to working with a dark-themed terminal. Let’s fix the colors!
Pimp my plot – A first approach⌗
Although I’ve moved away from this approach (see below: A more elegant approach), I’ve decided to leave this section in the article. It highlights how sagemath lacks configurable defaults and how to work around that.
First off, we clearly want a transparent background for our plots: this is the most straightforward, best looking solution. Fortunately, sage actually has some modifiable default option for this. We will also set some defaults for the legend options.
from sage.plot.graphics import Graphics
Graphics.SHOW_OPTIONS['transparent'] = True

# Extra defaults for legends
Graphics.LEGEND_OPTIONS['framealpha'] = 0
Graphics.LEGEND_OPTIONS['shadow'] = False
Graphics.LEGEND_OPTIONS['labelcolor'] = 'white'
Graphics.LEGEND_OPTIONS['font_size'] = 'large'
Now we need to fix the color of everything else, seeing as black-on-almost-black is downright unreadable.
Surprisingly here, Sage is not cooperative at all. Many colors in the software are simply hardcoded. Some example include: axes, labels, tick labels, legend background and box, curve color, background color. Again, I could (and might!) contribute to the project upstream, but in the few hours I had I decided the best way was to patch the hardcoded colors that were easy to patch. As it turns out, the first three colors of that list are hardcoded in the same spot ! Let’s patch this.
def new_graphics_init(self):
    self._axes_color = (1,1,1) # white
    self._axes_label_color = (1,1,1) # white
    self._axes_width = 0.8
    self._bbox_extra_artists = []
    self._extra_kwds = {}
    self._fontsize = 12
    self._axes_labels_size = 1.6
    self._legend_colors = []
    self._legend_opts = self.LEGEND_OPTIONS # actually use the default options instead of {}
    self._objects = []
    self._show_axes = True
    self._show_legend = False
    self._tick_label_color = (1, 1, 1) # white

Graphics.__init__ = new_graphics_init
Here, we’re simply replacing the constructor to use our default axis color and legend options. Note however that, given the structure of the constructor, it would be actually very easy to use default values here! There’s even a SHOW_OPTIONS filled with default parameters.
Now onto 3D plots. The default (and sole) renderer for image output is Tachyon. There is a much superior threejs viewer, but I’d rather sage showed me an image render by default and the threejs viewer on demand (which is the opposite behavior to the default one).
from sage.plot.plot3d.base import SHOW_DEFAULTS,Graphics3d
SHOW_DEFAULTS['viewer'] = 'tachyon'
Because Tachyon is a raytracing engine, the background of a scene should be black. To make up for this, Sage adds a plane orthogonal to the camera’s direction with a solid color texture (white). Unfortunately for us, this texture is (once again) hardcoded. To make things worse, the hardcoded texture is injected in a Cython class, which makes it immutable: no monkey patching for us!
Pimp my plot – A more elegant approach⌗
Hacking and injecting custom defaults everywhere in Sagemath is both a never-ending endeavour and a hell to maintain. There is also another, maybe more substantial issue that arises whenever you want a graphic generated by Sage outside of sage: all of your injected defaults are used, and they probably look terrible on a white background.
Therefore, we’d like to find a solution that:
- Doesn’t pollute Sage’s API with nonstandard defaults
- Applies to all image output in the terminal
- Makes plots and renders look good on a dark background
Those requirements heavily hint towards including these customization as part of the viewing process. Part of why I didn’t go for this approach at first was that it seemed like applying transformations only to the rendered image would yield bad result, because the transformation would be oblivious to the actual (mathematical) content of the picture.
As it turns out, Sage’s defaults are sensible enough that this can all be included in some fairly simple filters. Let’s look through what we want:
- We want to invert the lightness scale: black text and lines should be turned white and a white patch should be turned to a plain black one (or, as we’ll see later, we want it to look like our terminal’s background color)
- We want to keep colors’ hues the same
- We don’t want to invert the lightness scale for 3D rendered objects (inverted shadows look weird)
The first two requirements dictate a transformation in the HSL colorspace: L ← 1-L, leaving other values untouched. Since 3D rendered objects usually have a non-zero saturation value (this is a good enough assumption for my personal use anyway), we can turn use this to our advantage: if the saturation is nonzero, don’t touch anything, otherwise invert it. This transformation will still respect the intent of the first requirement. The new transformation looks like this: L ← 1-L if S == 0 else L.
I’ve added some extra filters for my aesthetic pleasure, like toning down the saturation on every color.
Putting all of this into one imagemagick command looks and using it in the REPL looks like this:
display_cmd = 'magick {0} -colorspace HSL -channel L +fx \'g == 0 ? 1 - b : b\' -channel S +fx \'s*0.75\' +channel -colorspace sRGB -fuzz 2% -transparent black -trim - | kitty +kitten icat'

def dh(plain_text, rich_output):
    if isinstance(rich_output, OutputImagePng):
        filename = rich_output.png.filename(ext='png')
        plain_text_str = plain_text.text.get_str()
        os.system(display_cmd.format(filename))
        return ({'text/plain': ''}, {})
    return old_backend_displayhook(plain_text, rich_output)
We can even add support for animations with
    if isinstance(rich_output, OutputImageGif):
        filename = rich_output.gif.filename(ext='gif')
        plain_text_str = plain_text.text.get_str()
        os.system(display_cmd.replace(' -trim', '').format(filename))
        return ({'text/plain': ''}, {})